Overview
Built this during the LA wildfire season. The goal was simple – take a fully manual fire-tracking process and automate it so people could get updated information without doing anything themselves. Lambda pulls the data, Glue and Athena clean it up, and Tableau refreshes every 3 hours on its own. Cut manual tracking effort by 85%.
How It Works
Lambda functions run on a schedule, pulling raw wildfire data from external sources and dropping it straight into S3. Glue crawls and catalogs whatever lands there, keeping the schema up to date without any manual intervention. Athena sits on top and handles the cleanup – consistent schema, filtering incomplete records – so only clean data reaches the dashboard. Tableau connects directly to Athena and auto-refreshes every 3 hours, no manual steps needed.
Live Dashboard
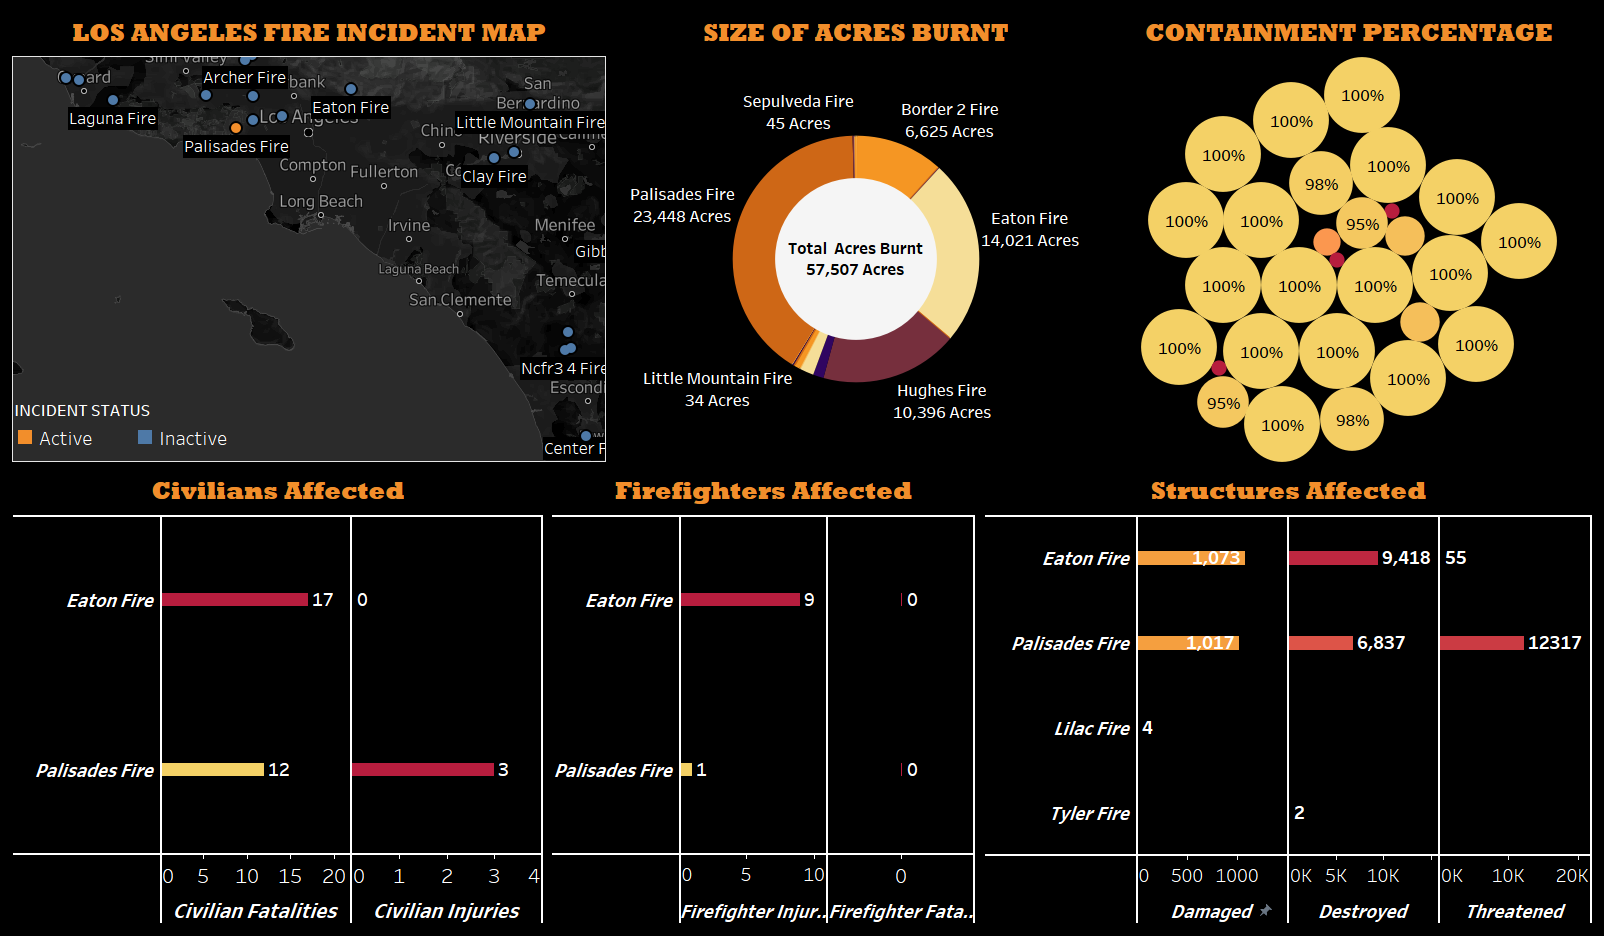
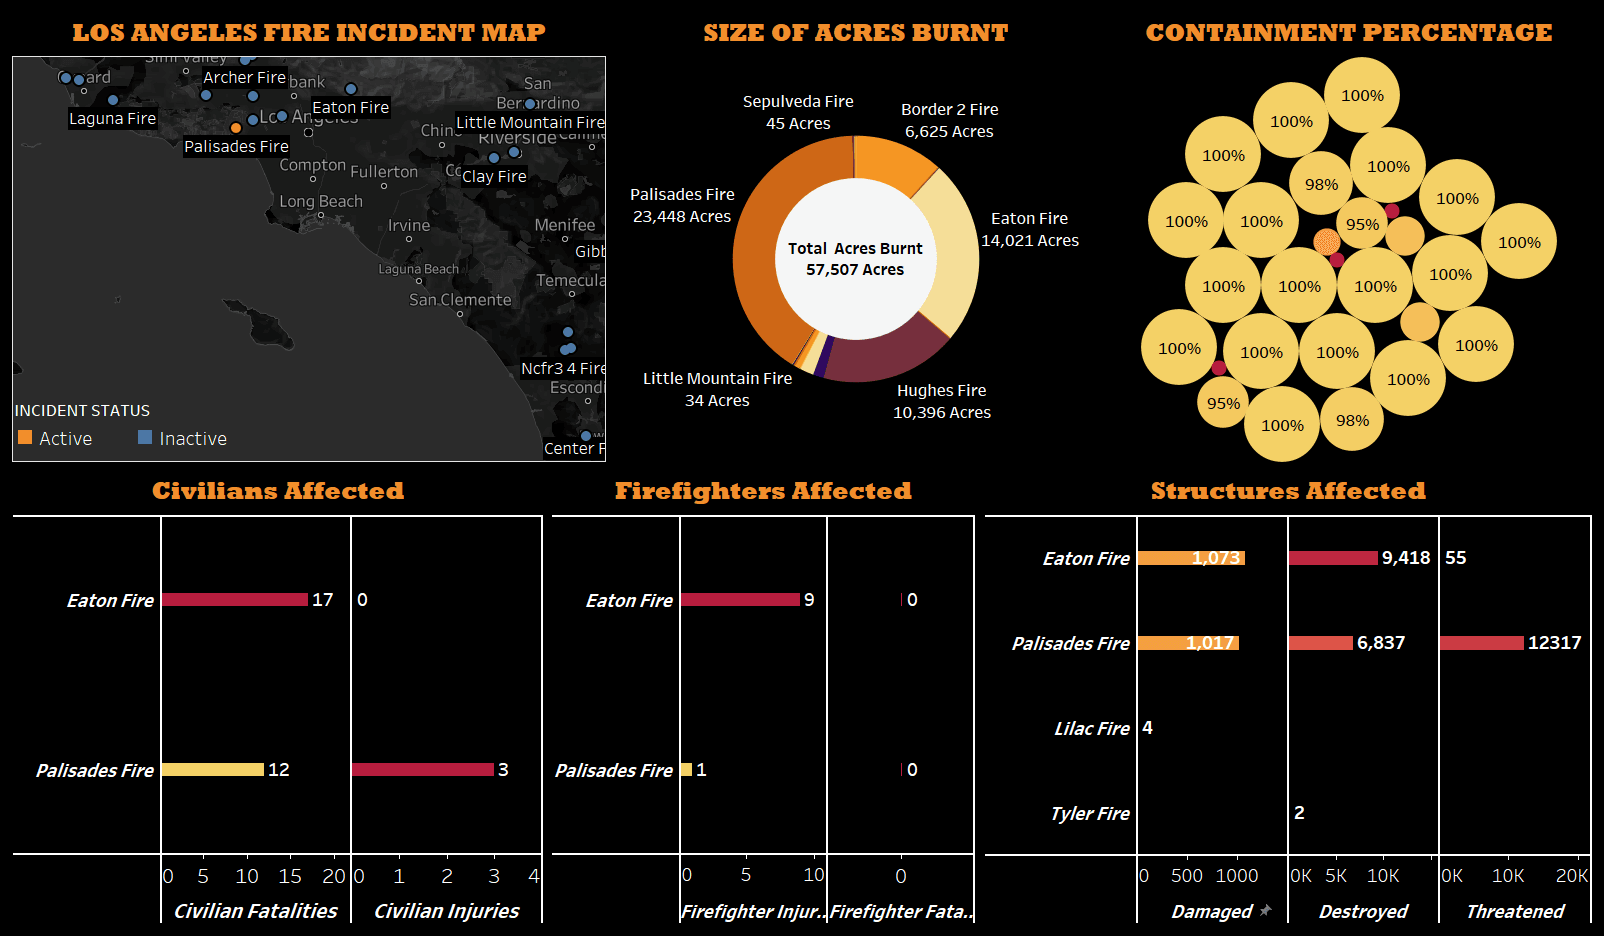
The final Tableau dashboard tracks fire incident locations, acres burned, containment percentages, and impact across civilians, firefighters, and structures – all updating automatically as the pipeline runs:
Results
- 85% reduction in manual tracking effort
- Live dashboards refresh every 3 hours automatically
- Clean, consistent data across all stakeholders – no more stale or mismatched numbers
Technologies Used
- AWS Lambda – scheduled data ingestion
- AWS S3 – raw and processed data lake layers
- AWS Glue – schema crawling and cataloging
- AWS Athena – SQL transformation and querying
- Tableau – live geospatial dashboards with direct Athena connection